

WooCommerce to Power BI Integration: Build Your eCommerce Dashboard

You didn’t start a WooCommerce store to spend Friday afternoons buried in spreadsheets. That’s where most store owners end up anyway: checking orders here, cross-referencing payments there, guessing at what’s actually driving revenue. WooCommerce to Power BI integration puts an end to that guesswork. Instead of piecing together numbers from five different tabs, you get one live dashboard that shows what’s selling, what isn’t, and where your money is actually going. It updates on its own, every day. This guide walks you through how to set it up, step by step.
The Problem Nobody’s Talking About
You’re selling on WooCommerce. Sales are coming in. Inventory’s moving. But your data lives in different places.
Orders in WooCommerce. Customer info scattered across email and notes. Payments in Stripe. Inventory in a spreadsheet somewhere.
Every Friday afternoon, you spend an hour pulling numbers together. Checking the week’s sales. Counting orders. Updating your mental spreadsheet of what sold and what didn’t.
That’s just how it works, right?
Not really. You could see all of this in one dashboard. Orders, revenue, product performance, customer behavior. Updated daily without lifting a finger.
That’s what WooCommerce to Power BI connection does. It pulls data from your store and arranges it so you can actually see patterns.
What Does WooCommerce to Power BI Mean?
Power BI is Microsoft’s tool for turning data into charts and tables you can look at.
When you connect WooCommerce to Power BI, you’re creating a connection between your store and Power BI’s dashboard software. New orders come in. Power BI pulls them in. You see them in charts and numbers.
That’s it. No exporting CSVs. No manually updating spreadsheets.
Your store keeps running. Power BI watches what’s happening and organizes it into something readable.
Why This Matters
A store owner notices sales dropped 12% last week. Did something break? Seasonality? Lost a customer? Without data, they guess.
With proper analytics, they see exactly what shifted. Product category issue. Customer retention dip. Or just normal fluctuation.
Here’s what actually happens:
You spot a product selling well but barely making money. You didn’t know that before. Now you do.
You see which customers buy once and never come back. Which ones keep buying. You adjust your strategy accordingly.
Inventory moving slowly eats into profits. Power BI shows you what’s stalled so you can clear it before it becomes a problem.
Revenue trends become obvious. You catch issues in their first week, not their fourth.
That’s it. You’re not predicting the future or outsmarting competitors. You’re just paying attention to your own data.
How WooCommerce to Power BI Integration Actually Works
Let’s break down what’s actually happening under the hood.
WooCommerce stores data in a database. Power BI connects to that database (or to an API, or through an ETL tool) and pulls data into a data model. Once there, you transform it, clean it, and visualize it.
If you haven’t sorted your WooCommerce inventory sync yet, that’s worth handling before Power BI. You want accurate stock data feeding your dashboards, not guesswork. There are a few paths to get WooCommerce to Power BI working:
Path 1: Direct Database Connection
Power BI connects directly to your WooCommerce database. This gives you the most complete data set and real-time updates. You need your database credentials and some basic technical setup. Best for stores with technical support on staff.
Path 2: REST API
WooCommerce has an API. Power BI can pull data through it. Slower than direct database connection (APIs have limits), but safer if you’re concerned about database access. Works well for stores prioritizing security over real-time speed.
Path 3: ETL Tools (Power Automate or Zapier)
Power Automate bridges WooCommerce and Power BI. Data flows through an intermediate platform that handles the connection. Easiest if you’re not comfortable with database connections, but slower than direct methods.
Path 4: Third-Party Connectors
Platforms like Fivetran, Stitch, or specialized WooCommerce Power BI connectors handle the entire setup. You pay for convenience. Best if you want it working today and don’t want to troubleshoot.
Most stores start with Path 3 or 4 because they work reliably without technical complexity.
Setting Up Your Dashboard, Step by Step
Get Your API Keys
Go to WooCommerce Settings > Advanced > REST API. Generate new credentials. You get a consumer key and secret. Save them.
Choose Your Connection Method
Pick Power Automate if you want it simple. Zapier works too. Or connect directly using the WooCommerce API. If you need your WooCommerce data synced to other business systems like accounting software, you might also want to look at how to properly set up that integration first before bringing data into Power BI.
Connect to Power BI
Open Power BI Desktop. Click Get Data. Search for your connector. Enter your credentials. Power BI pulls in your orders, products, customers.
Clean the Data
Your raw data has messiness. Product names with extra spaces. Dates in different formats. Duplicates. Power BI’s Power Query editor lets you fix this. Takes 20-30 minutes if you’re careful.
Build Your First Chart
Drag fields onto the canvas. Start with one number (total revenue). Add a simple chart (sales over time). Don’t overcomplicate yet.
Set It to Update Daily
Tell Power BI when to refresh. Each night at 2 AM is fine. It pulls new data, updates your charts automatically.
Done. You’re looking at live data now.
What Usually Goes Wrong (and How to Fix It)
Problem 1: Importing Too Much Data at Once
You try to pull five years of orders in one go. Power BI times out. Nothing happens.
Solution: Pull smaller chunks. Or set up incremental refresh (pull only new orders each time).
Problem 2: Test Orders Mess Up Your Numbers
You had a development environment. Fake orders got imported into Power BI. Your revenue looks higher than it really is. You trust the wrong numbers.
Filter out test data before it reaches Power BI.
Problem 3: Sensitive Data in Shared Dashboards
You pull customer email, payment info, addresses into Power BI. Then you share the dashboard with your team. Now customer data is everywhere.
Only pull what you need. Names and purchase history are fine. Leave payment details with your payment processor. If you’re working on WooCommerce order reporting, keep payment data separate from your dashboards.
Problem 4: Dashboards That Nobody Looks At
You build 30 different charts showing every angle. Nobody has time to look at them all. Nobody uses them.
Build one dashboard answering one question. “What are my top 10 products by revenue?” One chart. Done.
Problem 5: Calculations That Silently Break
You build a formula assuming product IDs never change. Someone edits a product. Your formula gives wrong numbers. You don’t notice.
Test your formulas. Review your numbers sometimes. Make sure they make sense.
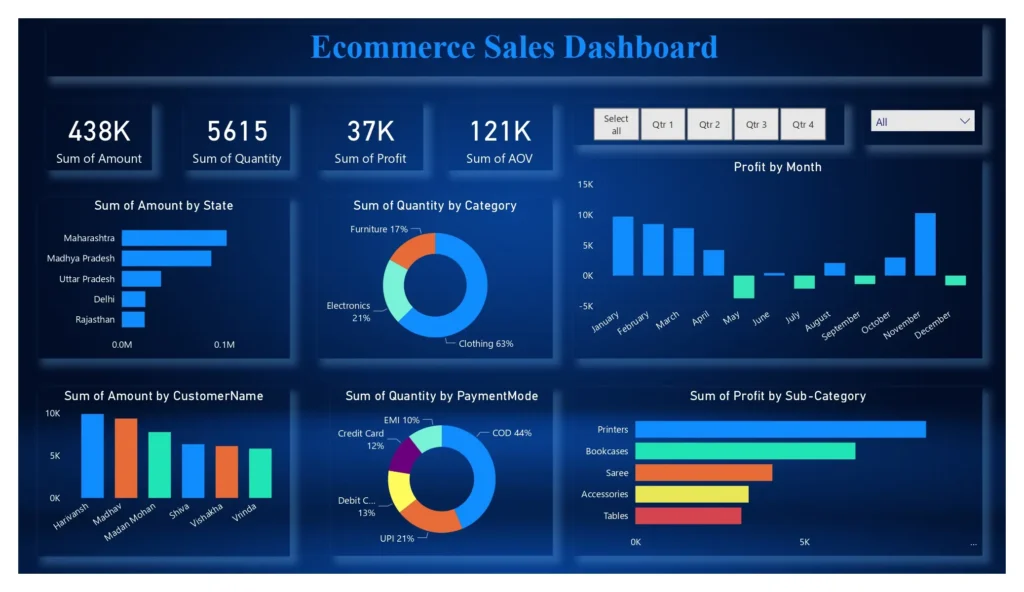
What Your Dashboard Looks Like
When you open it, you see:
Top section shows numbers. Total revenue this month. Orders this month. Average order size. How it compares to last month.
Below that, a chart showing sales over time. You can see what days are busy. What days are slow.
Product table showing which items sell most and which make most profit. Usually they’re not the same.
Customer section showing repeat purchase rates and average customer lifetime value.
Inventory status showing what’s low, what’s overstocked.
You check it each morning. Takes five minutes. You see what actually happened yesterday and what’s coming this week based on patterns.
Real Example: How It Changed One Store
A clothing store ran WooCommerce for three years without looking at their numbers carefully.
After they set up Power BI, they saw something: their “bestselling” category (winter jackets) made almost no money. Lots of volume. Tiny margins.
Their “slow” category (accessories) had better margins and more repeat customers.
They were spending 60% of their ad budget promoting the low-margin stuff.
They shifted budget over three months. Same revenue. Profit was up.
The data was always there. They just weren’t looking at it.
Comparing Your Connection Options by Cost and Speed
REST API + Power BI Direct Cost: Free | Complexity: Medium | Speed: Good | Best for: Technical teams
Power Automate Cost: $3-15/month | Complexity: Low | Speed: Good | Best for: Most stores
Third-Party Connectors (Fivetran, Stitch) Cost: $29-300/month | Complexity: Very low | Speed: Fast setup | Best for: Non-technical users
Azure Data Factory Cost: $1-100/month | Complexity: High | Speed: Very fast | Best for: Large operations
For most stores, Power Automate wins. Not free but cheap. Not hard to set up. Works reliably.
Tools That Work With WooCommerce to Power BI
If you’re serious about this integration, these tools make it easier.
Power Query (built into Power BI Desktop) cleans and shapes your data. Learn it.
DAX is the formula language Power BI uses. You’ll need basic DAX to create meaningful calculations.
Power Automate handles the plumbing between systems.
Azure Data Lake Storage is where enterprise stores keep their data.
You don’t need all of these. Start with Power Query and Power BI. Add others as you grow.
Making WooCommerce to Power BI Actually Stick
Integration is the easy part. Using it consistently is harder.
Schedule weekly dashboard reviews. Tuesday morning, 15 minutes. Look at the numbers. Ask questions. Act on trends.
Create alerts. Revenue drops below a threshold? You get a notification. High-value customer hasn’t ordered in 60 days? Alert. Use this to catch problems fast.
Document assumptions. If a calculation assumes something about your data, write it down. Future you will thank you.
Plan for growth. Your dashboard works fine with 100 orders a day. What about 1,000? Test this.
Connect your team. Marketing needs to see customer acquisition cost. Operations needs inventory data. Finance needs revenue trends. Share relevant dashboards with each department.
Key Takeaways
WooCommerce to Power BI integration takes you from guessing to knowing.
You stop spending Friday afternoons pulling numbers. You stop making decisions without data.
The setup takes a month if you do it yourself, maybe a week if you hire someone. After that, your dashboards update daily without effort.
You’ll see patterns you missed before. Slow inventory. Low-margin bestsellers. Your actual repeat customer rate. Things that were always true but invisible.
Getting Started
Start simple. Export one month of WooCommerce orders to a spreadsheet. What questions would you actually want answered? Revenue by product? Customer repeat rate? Average order value?
Write those down.
Then pick your integration method. For most stores, Power Automate is the middle ground. Not free, not expensive. Works reliably.
Google “WooCommerce Power BI” and follow the setup guides. They’re straightforward if you’re comfortable with API keys and basic database concepts.
Build one dashboard first. Answer your most important question. Don’t worry about building everything at once.
If you get stuck on Power BI specifics, you can find free resources at Microsoft’s Power BI help documentation. Most of the setup is connecting data and waiting for it to sync. The actual dashboard building is the fun part.
One month from now, you’ll know your business better than you do today. That’s the whole point.
Ready to See Your Numbers?
Setting up WooCommerce to Power BI takes time. But it’s worth it.
You’ll stop guessing about what’s working in your store. You’ll catch problems before they become expensive. You’ll know which products actually make money and which just look busy.
If you’re also managing inventory, accounting, and orders across multiple systems, getting WooCommerce properly connected is the first step to real visibility.
Start with one question you want answered. Build that dashboard. See what it shows you. You’ll want to build more after that.
Your next step: Export your WooCommerce data this week. Spend 30 minutes looking at it. Notice what’s confusing. Notice what you wish you could see. That’s your first dashboard.
Then set up the connection. One month later, you’ll have data that actually tells you how your business works.
Frequently Asked Questions
Can I use WooCommerce to Power BI if I’m not technical?
Yes. Use a third-party connector like Fivetran or a middleware service. Pay someone to set it up if needed. The payback comes in better decisions within weeks.
How much does WooCommerce to Power BI integration cost?
If you host WooCommerce yourself, free to $100/month depending on your chosen method. If you use third-party connectors, $30-300/month. Power BI license itself costs $10/month for basic, $20/month for premium. Most stores spend $100-300/month total.
How long until I see useful data?
If you use a third-party connector: one week. If you set it up yourself: 2-3 weeks. Dashboards take another week to build properly. So roughly one month from start to “I can make decisions on this data.”
Will Power BI slow down my WooCommerce store?
No. Power BI reads data, doesn’t write to your store. It’s passive. Your store performance is unaffected. Read-only queries don’t cause slowdowns.
What if I move from WooCommerce to Shopify later?
Your Power BI setup becomes unusable. But the skills transfer. You’ll rebuild it in a few days with a new data source. This isn’t a reason to avoid it.
Can I share Power BI dashboards with my accountant?
Yes. You control access. You can give read-only permission to specific dashboards. They see what you allow, nothing more. Great for tax preparation.
How often should my data refresh?
Daily is standard for most stores. Every morning you have yesterday’s data. That’s fast enough to catch most issues. Some stores need hourly refresh if they’re doing a lot of real-time decision-making. But that costs more and is overkill for most situations.
What if I need help building my dashboards?
Power BI has great built-in templates. CheckMicrosoft’s official Power BI documentation for guides. For custom work, hire a Power BI consultant (usually $100-150/hour). For a full custom build, expect $2,000-5,000.